Welcome to the 2015 Drewberry™ Protection Insurance Survey. The purpose of the survey was firstly to assess the financial situation of the UK workforce, secondly to understand what insurances workers hold and thirdly to understand why the take up rate of protection is below optimal.
The 2015 Protection Survey polled 1,820 workers spread across the United Kingdom. The survey was completed in partnership with online survey company One Poll.
Summary of Survey Findings
Unfortunately this survey paints a very worrying picture for the degree of financial protection currently experienced by a significant proportion of the UK workforce.
Despite a prevalent experience of incapacity among survey participants, the situation is one of insufficient employer provided sick pay entitlement; extremely limited savings for the majority of the sample; and a level of State Incapacity Support that is only enough to cover half of the median family’s household bills.
Despite this, the take up rate of income protection, critical illness cover and life insurance is extremely low, and far below what would be considered socially optimal.
What is stopping people…
Although there is a basic desire for protection insurance and many recognise it as important, workers are put off taking out cover because they view it as being too expensive and have a fundamental lack of trust in insurers paying claims, despite insurers having published their claims statistics for a number of years now.
More research is needed to understand why consumers believe protection insurance to be expensive but it is clear that if there is a significant underestimation of the risk of incapacity (as found in our 2013 survey) and significant mistrust in insurers paying claims then more work needs to be done to make consumers aware of their incapacity risk and reassure the public that claim payment rates are actually very good.
What can we do?
Drewberry would suggest that claim payment statistics need to be compiled with a consistent methodology, published centrally and promoted by an independent body, such as the Money Advice Service or even the Financial Conduct Authority. Either way a budget needs to be set for the promotion of these statistics. The step to publish them was an excellent move forward, but it is useless if they are not comparable, no one sees them or believes them.
Key Survey Highlights
|
Incapacity is Prevalent
36% of the sample has had to take a month or longer off work due to incapacity, with 1 in 5 workers needing to take over 3 months off work. |
Lack of Sick Pay
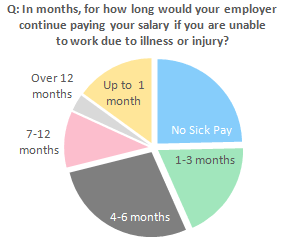
Over half of the sample (58%) stated that they would receive 3 months or less in employer provided sick pay, with 24% reporting that they did not receive any sick pay. |
Very Limited Savings
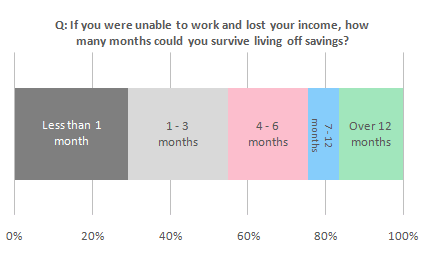
Over half of the sample (55%) only had up to 3 months of income in savings, with 29% having less than a month in savings. |
|
Low Protection Take-up
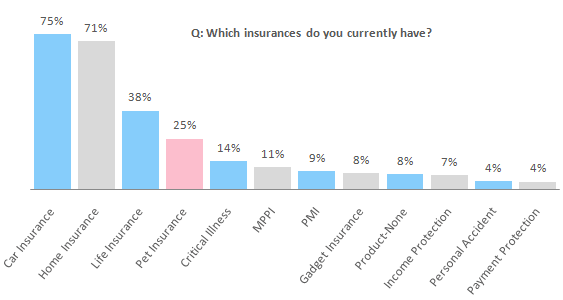
Only 7% held an income protection policy. 50% of families and 62% of single parents do not have any life insurance. |
Questionable Insurance Spend
3.5 times as many people choose to insure their pets compared to their own income (25% of the sample had pet insurance). |
ESA Insufficient
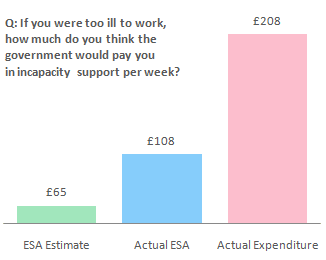
With median weekly bills of £208, even an average family would need to cut their household expenditure by 48% to survive on incapacity benefit.** |
|
Income Protection Desirable
77% of the sample was willing to pay some amount for income protection However the median proportion of income the sample was willing to pay was only 0.7%, or £20 per month. |
||
|
Lack of Insurer Trust
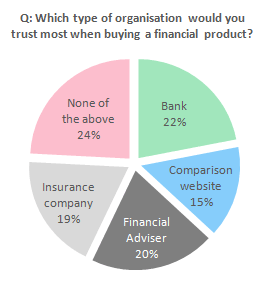
Despite continued banking scandals, a higher proportion (22%) of the sample would still trust a bank more than an insurance company (19%). |
Insurance
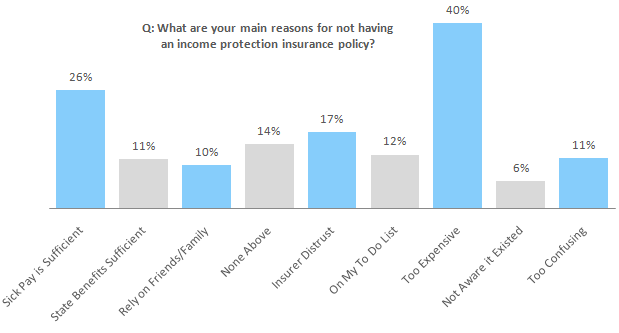
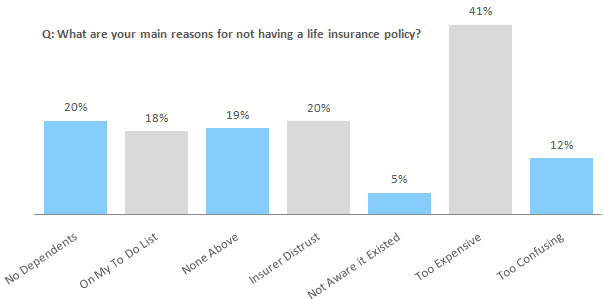
“Too Expensive” The main reason for not having income protection (40% of the sample) or life insurance (41%) was because it is viewed as being too expensive. |
Recognising the Value Too Late
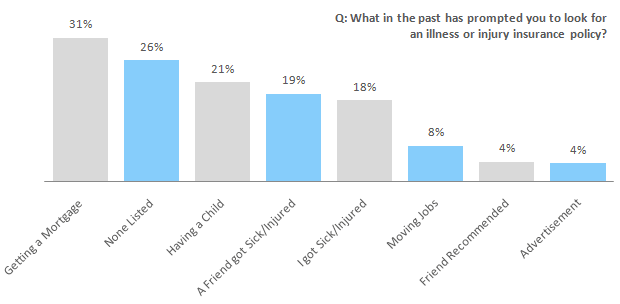
Over 1 in 6 people look for incapacity protection when they are already ill or injured. |
The Survey Demographics
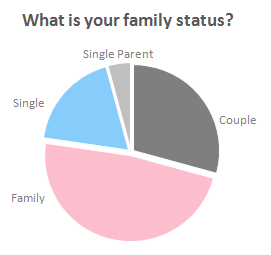
Family StatusThe largest single proportion of the sample stated that they had a family, representing 48% of the respondents. The next largest group were couples, representing 29% of the sample. The question was added to the survey this year to allow for cross-sectional comparisons to be made, which is provided in the survey analysis section. |
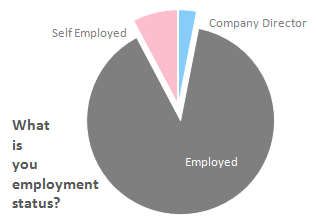
Employment StatusThe vast majority of the sample was in paid employment, representing 89% of respondents. In our 2013 Health & Protection Survey 93% of respondents reported that they were employed so this lower figure in 2015 could be consistent with a continued trend towards self-employment, which began at the start of the recession in 2008. |
 |
 |
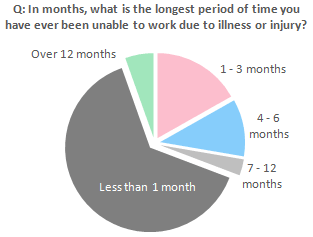
IncapacityFortunately, the majority of workers in this sample reported that they had been off work due to illness or injury for less than one month, representing 64% of the sample. However, this means that the remaining 36% of the sample has had to take a month or longer off work due to incapacity, with 1 in 5 workers needing to take over 3 months off work. Figures are likely to underestimate the true risk of incapacity as the survey samples workers only and therefore does not include those individuals who were never able to return to work. |
Sick Pay EntitlementTaking out the 15% of the sample that did not know their sick pay entitlement, as much as 24% of the remaining participants reported that they did not receive any sick pay (over and above Statutory Sick Pay of £87.55 per week for up to 28 weeks). Over half of the sample (58%) stated that they would receive 3 months or less in employer provided sick pay. Sick pay is clearly not the solution to covering the risk of long-term incapacity (bearing in mind that 1 in 5 of the sample stated that they had been off work due to illness or injury for over 3 months). |
 |
 |
Personal SavingsNot only did this sample of workers have limited sick pay, they also had limited savings for a rainy day. Over half of the sample (55%) only had up to 3 months of income in savings, with 29% having less than a month in savings. Worryingly, cross sectional analysis showed that of those respondents that stated they had less than one month in savings, 41% said they had no sick pay entitlement. This means that this significant cohort of the sample effectively have no safety net other than State benefits. |
|
Current Insurance PoliciesThe results were broadly consistent with the results found in 2013. The main difference is that now 25% of the sample stated holding pet insurance, compared to 19% in 2013 (a rise of over 30% in two years). This now means that 3.5 times as many people choose to insure their pets compared to their own income (only 7% of respondents stated owning income protection). Worryingly, when looking at a cross-section of data based on family status and life insurance ownership, it was found that as much as 50% of families and 62% of single parents do not have any life insurance. |
|
|
|
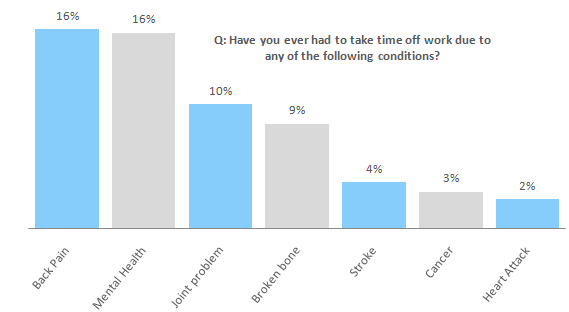
Causes of IncapacityIn the incapacity longevity question below it was found that over 1 in 3 of the sample (36%) had taken over one month off work due to incapacity during their working life to date. Listing the most common reasons for income protection and critical illness cover claims, close to 1 in 6 of the sample had to take time off work for either back pain or a mental health related condition. As a side point, it is interesting that none of the top four reasons for needing to take time off work are usually covered by critical illness cover (except in extreme cases where a claim can be made under the Total and Permanent Disability clause). All of these conditions would be covered by income protection and forms one of the key reasons why it is so highly rated by advisers. |
|
|
|
Consumer Protection Perceptions
Incapacity Benefit EstimationAs in the 2013 survey, respondents underestimated the amount of incapacity benefit available from the State. The maximum amount of benefit (called the Employment and Support Allowance) is £108.15 per week. This sample significantly underestimated ESA, believing it to be only £65 per week. The government’s continued communication of the necessity to make budget cuts could be a reason why the public’s estimation of State incapacity support fell from £70 per week in our 2013 survey to £65 in 2015. In another question the participants were asked how much they needed each week to pay all their household bills. The median answer was £208 per week. Given the maximum amount of ESA available of £108.15 per week, even the median family would need to cut their household expenditure by 48% to survive on ESA, which is unlikely to be possible. |
|
|
|
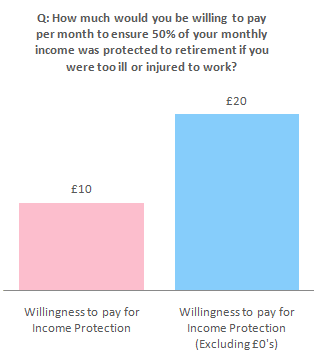
Willingness to Pay for Income ProtectionAcross the whole sample the median amount that participants were willing to pay for income protection was £10 per month. However, excluding those who said they weren’t willing to pay anything, of those who were willing to pay the median rose to £20 per month. It was interesting to find that 77% of the sample was willing to pay some amount for income protection (only 7% of respondents actually had cover). Naturally the nominal amount someone is willing to pay is arbitrary because it really depends on how much they earn. Excluding those who were not willing to pay for income protection, the median proportion of income the sample was willing to pay was 0.7%. This result was consistent with the results from 2013 and well below the 1.5% of income spent by Drewberry clients (i.e. the amount needed to gain sufficient coverage). |
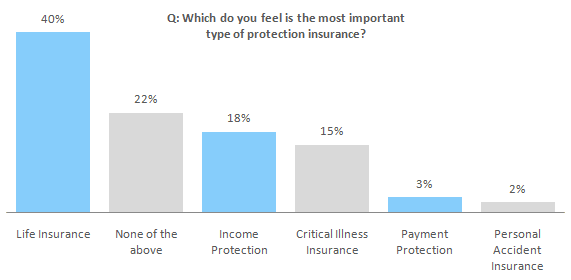
Most Important Protection InsuranceAcross the entire sample of workers, 40% stated that life insurance was the most important type of protection insurance. There was very little difference in perceived importance between income protection and critical illness cover, with 18% and 15% of respondents reporting it as the most important type of policy. Given this it raises questions why critical illness insurance sales outpaced income protection by five times in 2013 (Swiss Re Term & Health Watch, 2014). It is interesting that 22% of the sample didn’t believe any of the policies to be important. Given a lack of trust for insurers (reported below), it is possible that a proportion of this group selected ‘none of the above’ as a protest vote against the industry. |
|
|
|
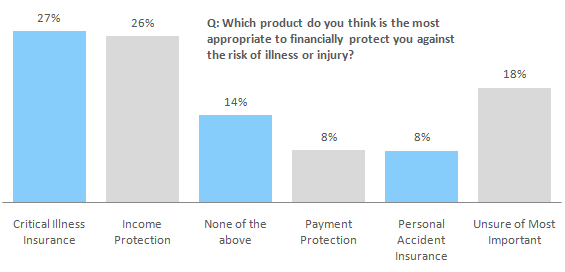
Most Important Incapacity ProtectionAsking specifically about which type of illness and injury insurance they believe to be the most important, again there is very little difference between the proportion that selected critical illness cover and income protection. However, in this question critical illness cover came out slightly ahead with 27% of respondents selecting critical illness cover compared to 26% selecting income protection. With the sample being split between income protection and critical illness cover and 18% of respondents stating they were unsure which type of illness protection was most important, there is a clear need for insurers and advisers to provide more educational information about protection. |
|
|
|
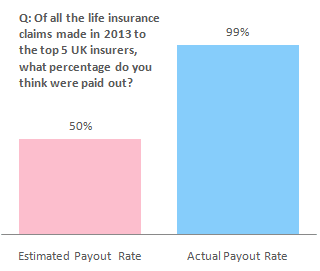
Insurer TrustOver the last three years nearly all life insurers have started publishing their claim payout rates. Despite this, this section of workers estimated the payout rate for the top five life insurers to be 50% of all claims, i.e. the public believe that only half of life insurance claims are actually paid. This estimate is in stark contrast to the actual payout rate. Taking the payout rates for Aviva, Legal & General, Liverpool Victoria, Scottish Provident and Friends Life or 2013 the average payout rate was 99% of all life claims. It is clear that more work needs to be done to promote these excellent figures. |
|
|
|
Trust in Financial ServicesDespite all the negative press the banking industry has received since the financial crisis began in 2008, a higher proportion (22%) of this sample would still trust a bank more than an insurance company (19%). However, for the financial services industry as a whole, the majority of the sample (61%) would trust regulated organisations (banks, insurers and financial advisers) over other sources when buying a financial product. |
Reasons For Not Having Income Protection InsurancePrevious questions have highlighted that the public significantly underestimate insurer payout rates and have a general lack of trust for insurers (even relative to banks). These results are supported by 17% of the sample that did not have income protection stating a distrust of insurers paying claims as a reason for not having income protection. However, the main reason for not having income protection was because it is viewed as being too expensive, with 40% of respondents stating this reason. Despite only 14% of the sample reporting a sick pay entitlement of over 6 months, 26% of the sample stated that they don’t have income protection because they believe that their sick pay entitlement is sufficient. |
|
|
|
Reasons For Not Having Life InsuranceSimilar to the results for not having income protection, of those respondents that do not currently have life insurance, the main reason was the product being too expensive, with 41% stating this reason. Again, similar to the income protection results, 20% of respondents stated that they don’t hold life insurance due to a distrust of life insurers paying claims (despite actual pay out rates of around 99%). |
|
|
|
Consumer Buying Habits
Reasons For Looking Into Protection InsuranceExcluding the 40% of the sample that stated they had never looked for an injury and illness policy, the main reason for looking for this type of protection was to cover a mortgage (31% of respondents). As one would expect, another common reason for looking for incapacity protection was having a child, with 21% reporting this reason. It is very worrying that 18% of the sample looked for an illness and injury insurance policy when they were already ill or injured themselves. In other words, over 1 in 6 people look for incapacity protection when they are already ill, and it is potentially too late to gain cover. |
|
|
|
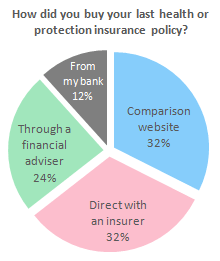
Where Protection Was PurchasedInsurers, comparison websites and advisers all increased their share of consumers relative to their respective shares in our 2013 survey. Those share increases were at the expense of the share going to banks, which was 19% in 2013 but only 12% in 2015. This is likely due to the fact that many banks significantly scaled back their insurance sales activities in the wake of the PPI mis-selling scandal. Despite the lack of independent advice or even fair product comparison, 32% of respondents that bought a protection policy did so directly with an insurer. An equal amount compared and bought a policy via a comparison website. 24% of respondents bought through a financial adviser. |
|
|
|
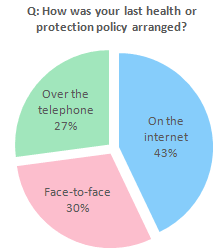
Method of Buying ProtectionAs in the 2013 survey, the largest number of respondents (43%) reported that they arranged their protection policy on the internet, which could have been either through a comparison site or directly with an insurer. The proportion of workers reporting that they arranged their cover online actually fell from 2013, when it represented 49% of the sample. The proportion that arranged their cover face-to-face was unchanged at 30% of respondents but the proportion arranging cover over the telephone increased from 21% of the sample in 2013 to 27% in 2014. This is likely due to the rise of adviser firms with a direct or partnership based internet presence which actually transacts business over the telephone. |
Most Recognised Insurer
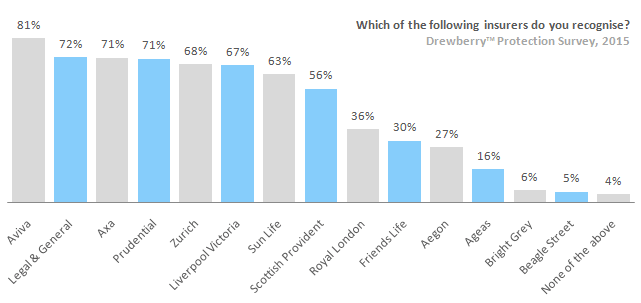
Biggest Insurance BrandsA new question added to the survey asks which insurers the respondent recognises. This metric will be monitored each year to identify which insurers have gained or lost brand recognition. Of the 1,820 workers surveyed 81% recognised Aviva, making this insurer the most recognised insurance brand across this sample of workers. Legal & General were the next largest insurance brand with 72% of the sample recognising this insurer. Despite a large amount of advertising, including a controversial TV campaign, only 5% of respondents reported recognising Beagle Street. This probably highlights the length of time (and capital) it requires to create a mainstream insurance brand. |
|
|
|

