
Health & Protection Insurance Survey 2013
Summary of Survey Findings…
The main focus of the 2013 survey was to try and identify why there is a below optimal take-up rate for protection insurance, with a particular focus on Income Protection Insurance. There is also a secondary focus on Private Medical Insurance (PMI), which yielded comparable findings.
Which? Money asserts that, “The one protection policy every working adult in the UK should consider is the very one most of us don’t have: Income Protection.”
Although this is also a commonly shared view among financial advisers, only around 8% of this survey sample held an income protection policy.
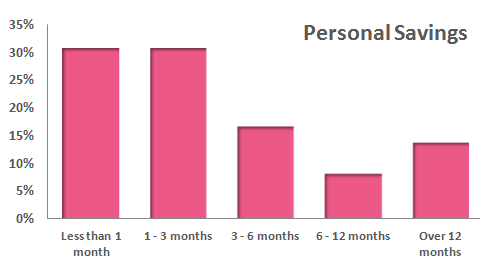
Worryingly, the general financial position of the sample was weak, with limited flexibility to cope with any sustained period of incapacity. For example, as much as 54% of the sample receives either no sick pay or up to a maximum of 3 months full pay. Furthermore, only 39% of the sample would have sufficient savings to survive for over 3 months without their regular income.
Despite this, the risk of incapacity is very real. In 2011, The Guardian / Unum Survey found that 10% of the population had been off work for over 6 months due to ill health. In this sample of workers, it was found that 15% of workers had previously been off work for over 3 months.
Understanding the Importance of Protection
Although income protection has a low take-up rate, around 21% of the sample recognised this product as the most important protection policy available (behind life insurance with 45% of the sample). An additional 25% of respondents ranked income protection as the second most important protection policy.
It is often argued that the take-up rate for income protection is low because consumers believe that the state will take full care of them during times of incapacity. However, in this survey it was found that respondents estimated incapacity support to be around £70 per week, relative to the actual Employment & Support Allowance of £99.15 per week. With a median sample income of £24,000 per annum, it is highly unlikely that £70 per week would be anywhere near sufficient to meet monthly financial obligations.
Causes of Underinsurance
Thus far, the results clearly set out the need for income protection in terms of a large proportion of workers having low savings, limited sick pay and a low expectation of state support. The survey respondents also appear to understand the importance of income protection, along with life insurance. The reason for such a low take-up rate must therefore relate to some other factor, with pricing being an obvious frontrunner.
In terms of risk perception, the sample of workers estimated the risk of being off work for over 6 months as 1 in 30, but The Guardian / Unum Survey results indicate that the risk is around three times higher at 1 in 10. The results of the survey would indicate that workers significantly underestimate the risk of incapacity, which would naturally make them less inclined to consider income protection or lead them to view this policy as expensive relative to the premium charged.
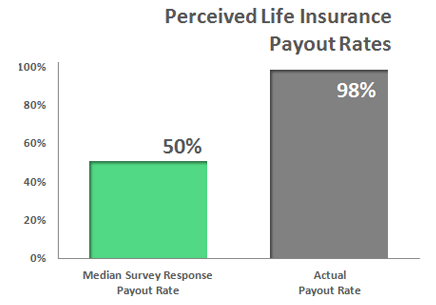
Another important factor relates to consumers perception of insurer payout rates. In this survey it was surprising to find that respondents estimated the payout rate for the UK’s leading life insurers as being at around 50% of all claims made. Given that the top five insurers had an average payout rate of 98% in 2011, it is clear that far more needs to be done to reassure consumers that all valid claims are paid.
Willingness to Pay
It is natural that the premium charged for a policy will have an impact on the take-up rate. On average, the sample of workers would be willing to pay around 0.7% of their gross earnings for an income protection plan. This compares to around 1.5% of earnings actually paid by a sample of Drewberry’s clients.
Given the results of this survey, it could be argued that far more consumer education is needed on the potential risk of incapacity and reassurance is necessary on payout rates, which should help to align the amount that consumers are willing to pay for this vital cover with the actual cost.
Demographics of Survey Respondents
The survey was completed by 2,000 workers spread across the United Kingdom. Of the 2,000 workers, 93% were employed and only 7% were self-employed.
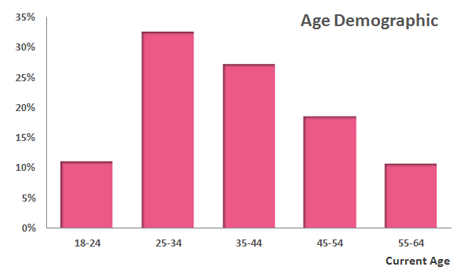
As the graph shows the vast majority of respondents were between the working ages of 25 and 54 years old (representing 78% of respondents).
The gender breakdown was fairly even with males representing 51% of the sample.
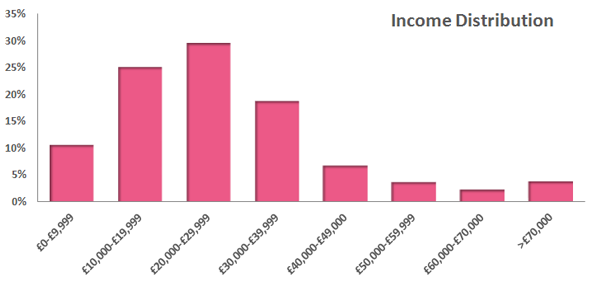
The income distribution of the sample was fairly representative of the wider working population, with the median income being £24,000 per annum.
Sick Pay, Sickness Absence and Savings
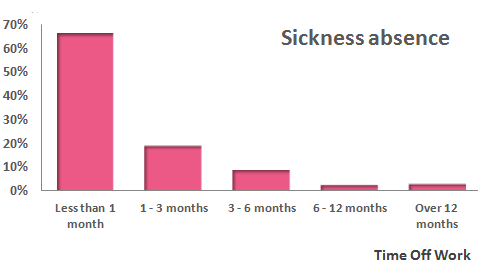
What is the longest period of time you have been unable to work due to illness or injury?
Of those surveyed 34% had spent over 1 month off work due to ill health and 15% had spent over 3 months off work for the same reason.
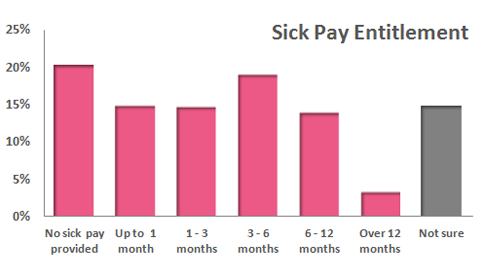
For how long would your employer continue paying your salary if you are unable to work due to illness or injury?
In this sample, 35% of workers receive either no sick pay or only up to one month of full pay. An additional 15% of the respondents were unsure of their sick pay entitlement.
This paints a strong picture for the need for income protection insurance, especially given that 34% of the respondents in this survey had already spent over 1 month off work due to ill health.
In addition, from the Unum / Guardian Survey in 2011 where it was found that around 10% of the population had been off work due to ill health for over 6 months, it builds the case further for income protection given that in this survey only 17% of respondents’ stated that they would receive over 6 months of sick pay.
If you were unable to work and lost your income, how many months would you survive living off savings?
Only 39% of the sample would have sufficient enough savings to survive for over 3 months without their regular income.
As much as 30% of the sample would have trouble lasting 1 month without their monthly pay. Thus, significant proportions of this sample have no or minimal sick pay and very limited savings.
Current Insurance Policies
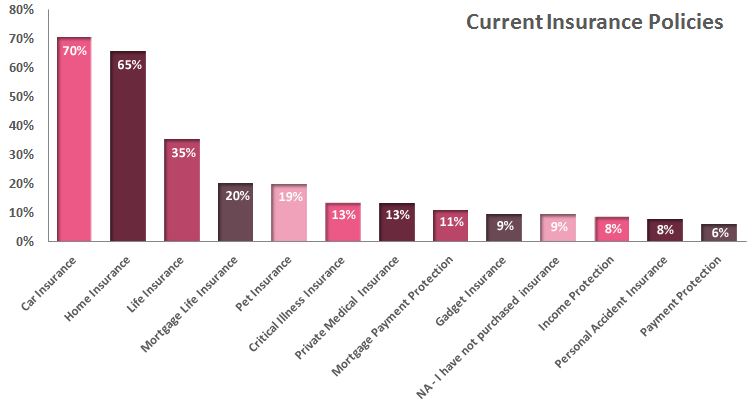
As one would expect, the majority of respondents hold car insurance and home insurance. With 81% of the sample being part of a couple or a family it also makes sense that 35% hold life insurance and 20% hold mortgage life insurance, which are the most commonly held types of protection insurance.
What is surprising is that more people (19%) have pet insurance than income protection insurance (8%). The sickness absence, sick pay and savings findings above would indicate that too few people hold income protection and therefore run a significant risk of future financial hardship. It must be remembered that it is a person’s income that pays for all these other insurances.
Survey Respondents’ Risk Perception
The results below would indicate that workers significantly underestimate the true risk of both incapacity and mortality and this is likely to be a significant factor in explaining why the population is so underinsured. Of course the cost of cover is a significant factor but if people understood the true risk faced then the premiums paid for cover might not look as ‘expensive’.
During their working life, what do you think are the chances of an individual being off work for over 6 months due to ill health? (1 person in every…)
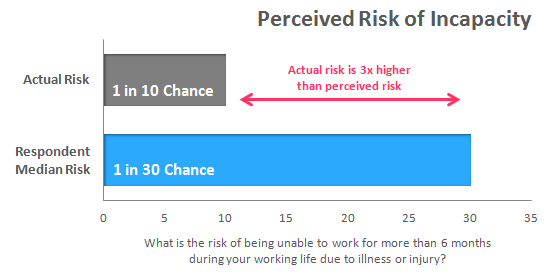
Given the low take-up of income protection insurance relative to the financial consequences faced, the survey aimed to establish workers perception of incapacity risk.
As it can be seen from the graph above, the sample believed there was a 1 in 30 chance of having to go off work due to illness or injury for over 6 months, whereas the actual risk is three times higher at 1 in 10 (The Guardian / Unum Survey 2011). If workers actually knew the real risk of incapacity then maybe the take-up of income protection would be higher.
What are the chances of an 18-year-old passing away before age 65? (1 person in every…)
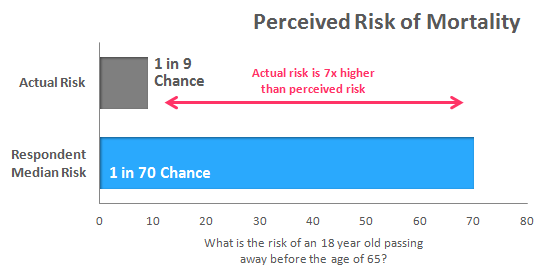
As many people do not take out life insurance because they assume ‘it won’t happen to me’, the sample was also asked to estimate the chances of an 18-year-old passing away before age 65 to ascertain their perception of mortality risk.
As it can be seen above, the sample believed there was about a 1 in 70 chance, whereas the real risk is actually over 7 times higher at 1 in 9 (based ONS Interim Life Tables from 2008-10).
If you were too ill to work, how much do you think the government would pay you in incapacity support per week?
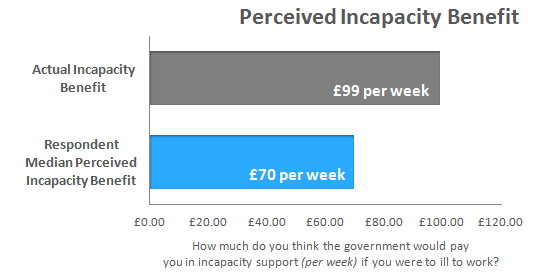
There is often the view that people do not take out protection insurance because of the belief that that state will provide for them in their moment of need.
In order to assess if this may be the case, the survey respondents were asked to estimate how much the state would pay per week if they were too ill to work.
The results above show that respondents thought the state would pay around £70 per week, where in actual fact Employment & Support Allowance pays £99.15 per week (which would be a 77% fall in income for someone earning £30,000 per annum). As it would be extremely difficult to survive on £70 per week, this result would indicate that the average worker does not believe the state would provide for them sufficiently.
How much would you be willing to pay per month to ensure 50% of your monthly income was protected all the way to retirement if you were too ill to work?
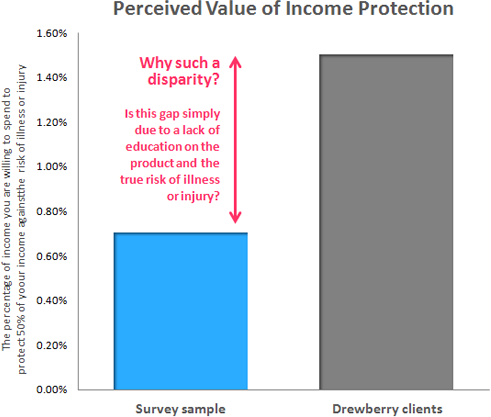
It is often argued that income protection insurance has a low take-up rate because it is too expensive. However, this may not be an issue of affordability but rather priority.
Furthermore, the price of something may seem cheap or expensive depending on how much use you think you’ll get out of the product.
As it’s been shown above, the respondents in this survey underestimated the risk of incapacity by around 3 times and therefore it may be reasonable to think that income protection is ‘too expensive’ or not as much of a priority.
The graph above shows that the survey respondents would be willing to pay around 0.7% of their income to cover 50% of their salary until retirement age (which has been calculated from the monthly premium they would be willing to pay relative to their stated income).
For a sample of Drewberry clients, the average amount that they actually pay for their income protection policy is around 1.5% of income. Thus, it is likely that further education on the need for income protection (including the actual incapacity risk faced) may help to alter the view that income protection is too expensive.
Protection Insurance Awareness
It is very common for consumers to view life cover as the most important policy but professional advisers often rank income protection as the most important product. This is often argued because there is a much greater chance of being off work due to illness or injury during your working life than there is of passing away.
In addition, it is common to view death as the worst case scenario, when in fact a disability could be far worse if a partner also has to cease working to care for them.
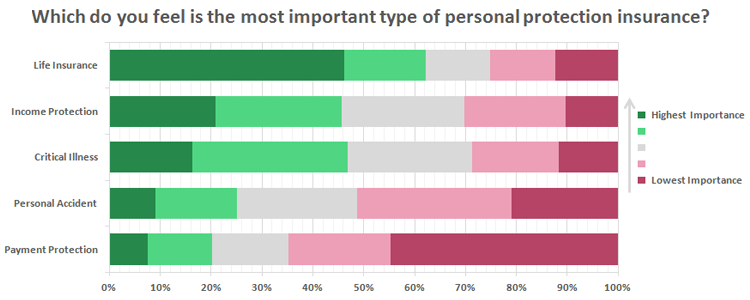
The graph above shows that respondents feel that life insurance is the most important protection product available, and this is followed by income protection and then critical illness cover.
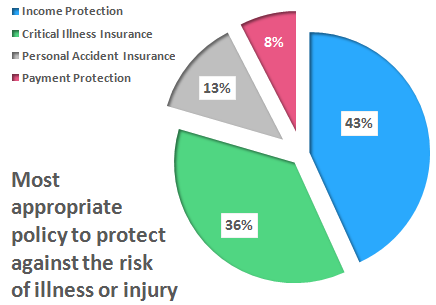
Which product do you think is the most appropriate to financially protect you against the risk of illness or injury?
Although it is very positive to see more respondents viewing income protection insurance as providing the most appropriate means of financial protection, more workers actually hold critical illness cover (13%) than income protection (8%).
This result may indicate that workers understand the value of income protection but it is not as well promoted by advisers who possibly add critical illness cover to life insurance due to a lack of income protection understanding, set-up ease or maybe even inertia.
What do you think income protection insurance is designed to cover?
Although income protection was selected as the most important means of financial protection against the risk of illness or injury there is clearly still consumer confusion about what income protection is actually meant to cover, demonstrated by only 17% of respondents selecting the correct answer of accident and sickness.
With the majority of this sample (67%) believing that income protection is designed to cover accident, sickness and unemployment or just unemployment on its own, it is clear that income protection is being confused with payment protection insurance by the majority of workers.
Thus, it is entirely possible that the recent PPI mis-selling scandal is having a detrimental impact on income protection sales.
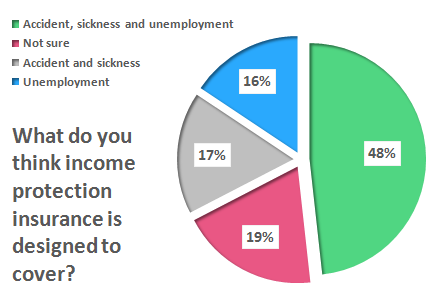
Although income protection was selected as the most important means of financial protection against the risk of illness or injury there is clearly still consumer confusion about what income protection is actually meant to cover, demonstrated by only 17% of respondents selecting the correct answer of accident and sickness.
Of all the life insurance claims made in 2011 to the top UK insurers, what percentage do you think were paid out?
One of the most surprising findings of the survey was the respondents’ perception of insurer payout rates. The graph shows that, on average, the sample believed that only 50% of life insurance claims were paid out by the top life insurers.
If we average the payout rate for Legal & General, Aviva, Liverpool Victoria, Scottish Provident and Bright Grey for 2011, the actual payout rate was around 98% of all claims made.
If consumers feel that insurers only payout 50% of claims then it is not surprising that workers are underinsured, and think that protection is ‘too expensive’. In order to promote protection sales it is therefore vital to highlight the strong payout rate to rest consumer fears.
The Private Health Insurance Market
Of the 2,000 respondents surveyed, a surprising 48% had received treatment in an NHS hospital in the last 5 years. In a separate question it was also found that 14% of the sample had received treatment in a private hospital in the last 5 years.
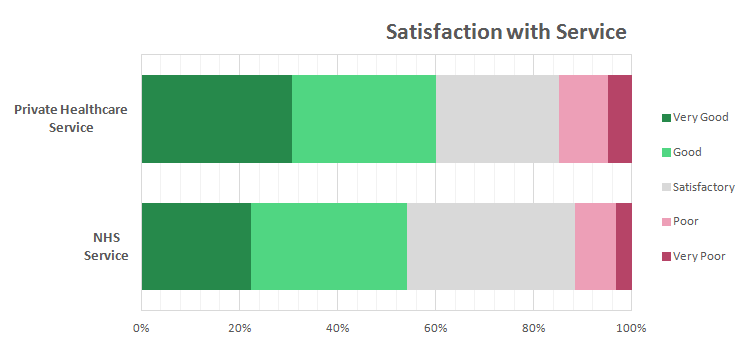
Overall the sample of workers were pleased with their experience of using the NHS, with only 11% rating the service provided as ‘poor’ or ‘very poor’, and 55% of the sample rating the NHS service as ‘good’ or ‘very good’.
Of those sampled who had received treatment in a private hospital within the last 5 years, 60% reported the service they received as either ‘good’ or ‘very good’ and 15% reported their experience as ‘poor’ or ‘very poor’.
Although a higher proportion of respondents rated the service provided privately as ‘poor’ or ‘very poor’ (15% relative to 11% with the NHS), the sample were also more likely to rate private healthcare as ‘good’ or ‘very good’ (60% relative to 55%). The main difference came in the ‘very good’ ranking, with 31% ranking private healthcare as very good relative to 23% for the NHS.
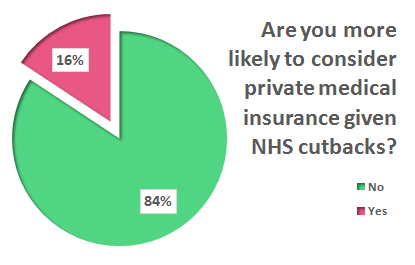
Have the ongoing spending cuts for NHS services made you more likely to consider private medical insurance?
Given government budget cuts and the impact this could have on NHS services, the respondents were asked if they are now more likely consider private medical insurance (PMI).
Of the 1,718 respondents who do not currently have PMI, 16% are now more likely to consider purchasing this type of cover. It will be interesting to see how this proportion changes over time as the impact of the NHS restructure filters through.
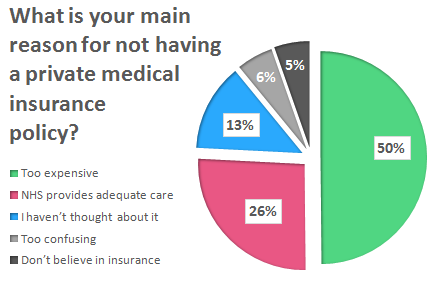
![NHS cutbacks and private medical insurance]() What is your main reason for not having a private medical insurance policy?
What is your main reason for not having a private medical insurance policy?
Of those respondents who do not currently have private health insurance, 50% stated the reason as being that the policy is ‘too expensive’.
This may indicate that the industry needs to develop more affordable products and / or market the benefits of holding PMI more effectively.
Sales Distribution
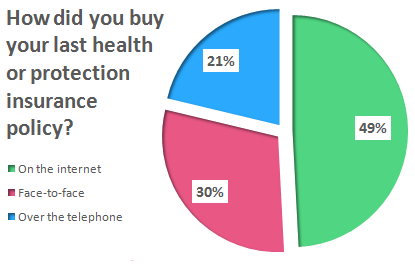
How did you buy your last health or protection insurance policy?
The growth of comparison websites over the last 5 years has been sizeable and this distribution channel now accounts for around 29% of health and protection sales, according to our sample data.
It is a little surprising that so many respondents (30%) have taken out cover directly with an insurer rather than going to an independent body, such as an adviser.

How was your last health or protection policy arranged?
In this day and age, it is not surprising that so many (49%) of respondents arranged their cover on the internet.
However, there is a concern that a rise in non-advised sales may lead to a higher rate of declined claims and possibly complaints in the future.
Why Speak to Us…
We started Drewberry because we were tired of being treated like a number and not getting the service we all deserve when it comes to things as important as protecting our health and our finances. Below are just a few reasons why it makes sense to let us help.
- There is no fee for our service
- We are independent and impartial
Drewberry isn’t tied to any insurance company, so we can provide completely impartial advice to make sure you get the most appropriate policy based solely on your needs. - We’ve got bargaining power on our side
This allows us to negotiate better premiums for you than you going direct yourself. - You’ll speak to a dedicated expert from start to finish
You will speak to a named expert with a direct telephone and email. No more automated machines and no more being sent from pillar to post – you’ll have someone to speak to who knows you. - Benefit from our 5-star service
We pride ourselves on providing a 5-star service, as can be seen from our 3953 and growing independent client reviews rating us at 4.92 / 5. - Gain the protection of regulated advice
You are protected. Where we provide a regulated advice service we are responsible for the policy we set-up for you. Doing it yourself or going direct to an insurer won’t provide this protection, so you won’t benefit from these securities. - Claims support when you need it the most
You have support should you need to make a claim. The most important thing when it comes to insurance is that claims are paid and quickly. We are here to support you during the claims process and make sure it’s as smooth and stress free as possible.
Contact Us
125-135 Preston Road
Brighton
BN1 6AF
Cookies
Drewberry™ uses cookies to offer you the best experience online. By continuing to use our website you agree to the use of cookies including for ad personalization.
If you would like to know more about cookies and how to manage them please view our privacy & cookie policy.


 What is your main reason for not having a private medical insurance policy?


